
The insight layer

Turn data into decisions.

Analytics brings together form responses, passes, attendance and connected data sources into one workspace you can actually read.

Inspect records, compare signals, build dashboards, connect external sources, and move from raw tables to useful visual summaries without leaving GalSol.
GS Forms Passes Attendance Google Sheets CSV / Excel AI dashboards
GalSol — Analytics
GalSol Analytics dashboard screenshot
What Analytics connects

One workspace. Many data signals.

Analytics is the place where GalSol data becomes readable. GS Forms responses are only the beginning: passes, attendance activity and external sources can all feed the same analytical workspace.

Analytics Insight workspace
GS Forms
Responses · totals · form states
Passes
Valid · pending · blocked
Attendance
Scanner activity · admitted
External data
Sheets · CSV · Excel
The central idea

Analytics gives every source a shared context.

Instead of switching between a form database, a spreadsheet and the attendance system, teams can inspect connected records in one place and decide what deserves attention.

01
CollectGS Forms supplies live registration and response data.
02
ConnectBring in Google Sheets or uploaded tabular files when the useful data lives elsewhere.
03
ExploreSearch, filter, sort and inspect records in table or pass views.
04
VisualiseTurn fields into dashboards, charts, tables and summary widgets.
05
ActUse the same workspace to understand what is happening and where action is needed.
Core Analytics features

Everything you need to read the data.

The product is divided into practical views so users can move from a high-level overview to the underlying records without losing context.

01

At-a-glance counts

See response, form, pass and attendance-related totals without opening individual records.

02

Search & filters

Find records by meaningful values such as name, email, token, form and status.

03

Multiple views

Switch between dashboard, data-table and pass-focused views depending on the job.

04

Record inspection

Open tabular data with sorting and pagination when the visual summary is not enough.

05

Data sources

Connect GS Forms data and external sources inside the same Analytics workspace.

06

Live refresh

Keep track of changes over time as connected data updates.

07

Dashboards

Build visual summaries with configurable widgets and layouts.

08

AI assistance

Use AI to suggest charts, build layouts and accelerate dashboard creation.

01 · Dashboard layer

Start with a picture of what matters.

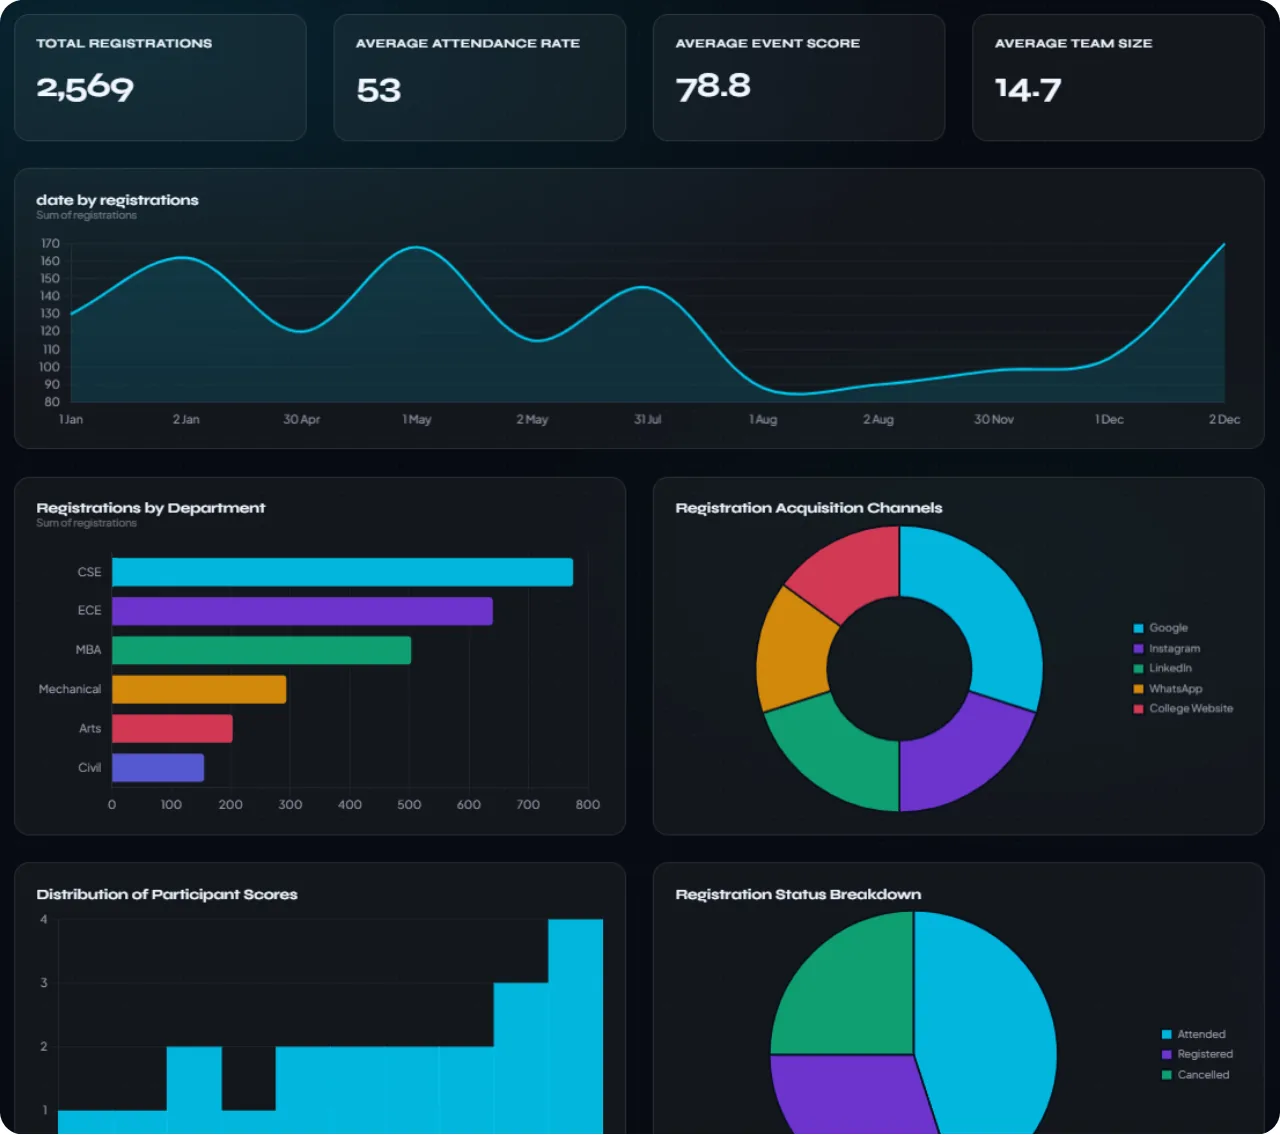
The dashboard is where Analytics becomes visual. Instead of starting from a blank page, the workspace can create useful layouts from the data and then let you refine them.
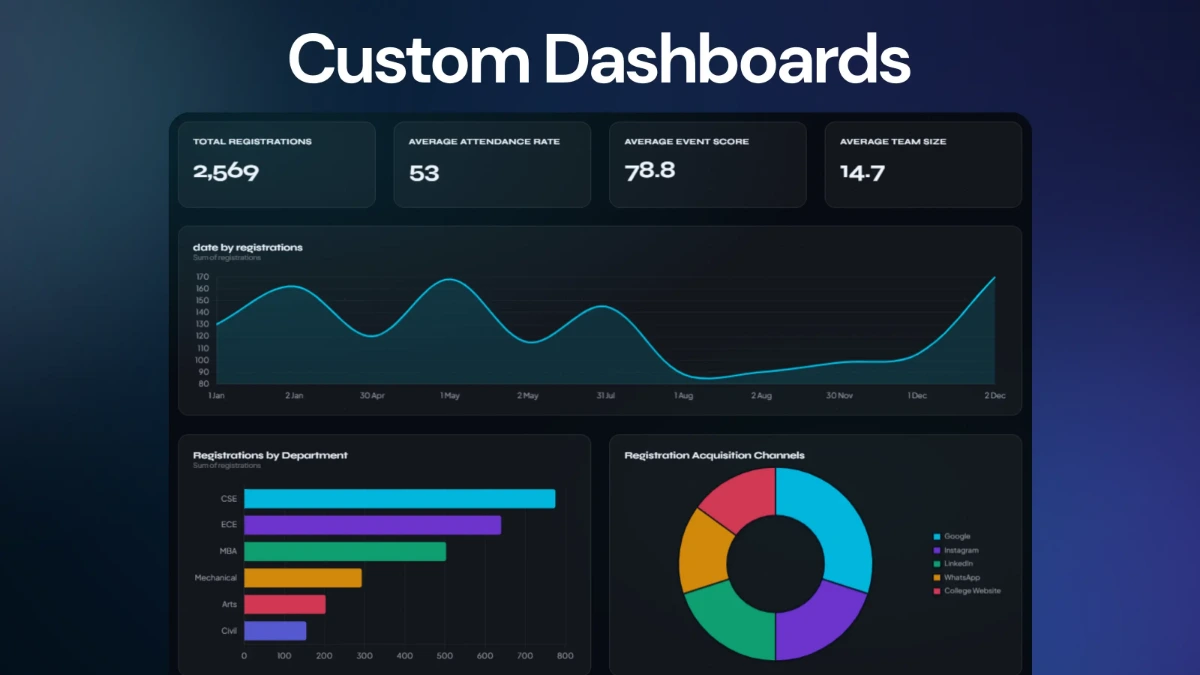
Stat cardsSurface the most important totals immediately.
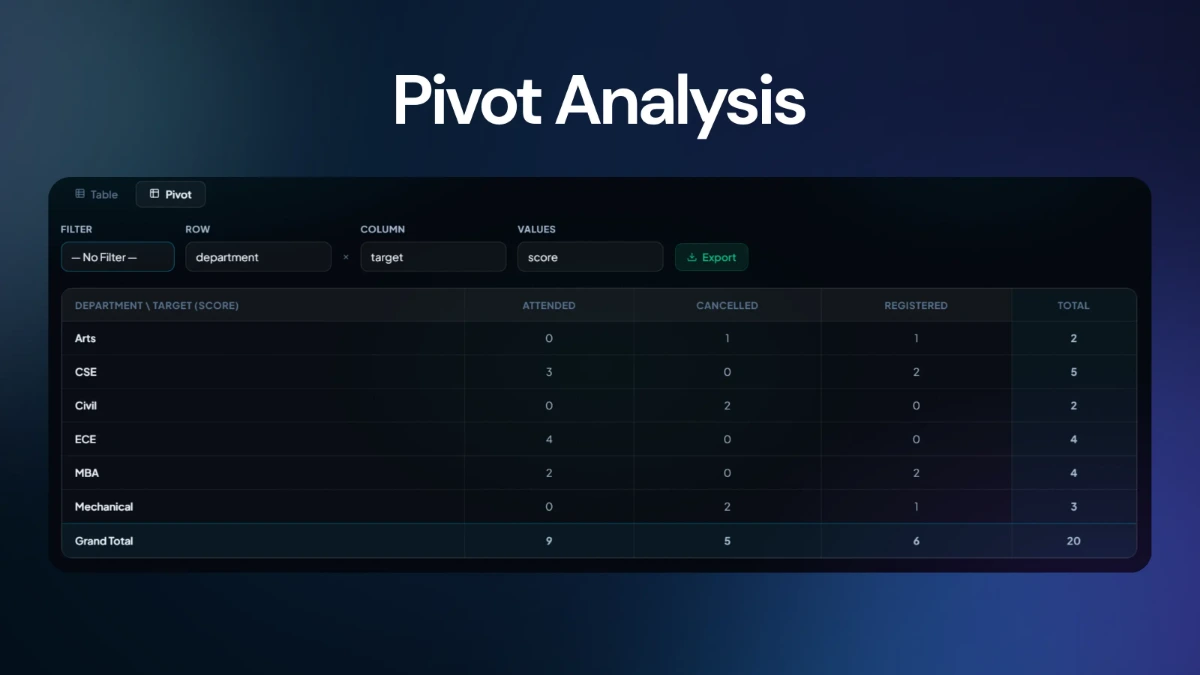
ChartsCompare categories and show movement over time.
TablesKeep the underlying records close to the summary.
Timeline viewsRead activity in temporal context.
SparklinesAdd compact trend signals without a full chart.
Heatmaps & summariesReveal patterns across larger datasets.
Dashboard editing: drag and drop widgets, save custom layouts, switch between generated suggestions and manual construction, and use AI to help restructure an existing dashboard.
GalSol — Analytics Dashboard
GalSol Analytics dashboard with stat cards, charts and widget layout
Dashboard — stat cards, charts, widget layoutPRIMARY
02 · Data explorer

When a chart isn't enough, open the records.

Analytics keeps a detailed data view beside the dashboard so teams can inspect the rows behind a number, not just trust a summary.
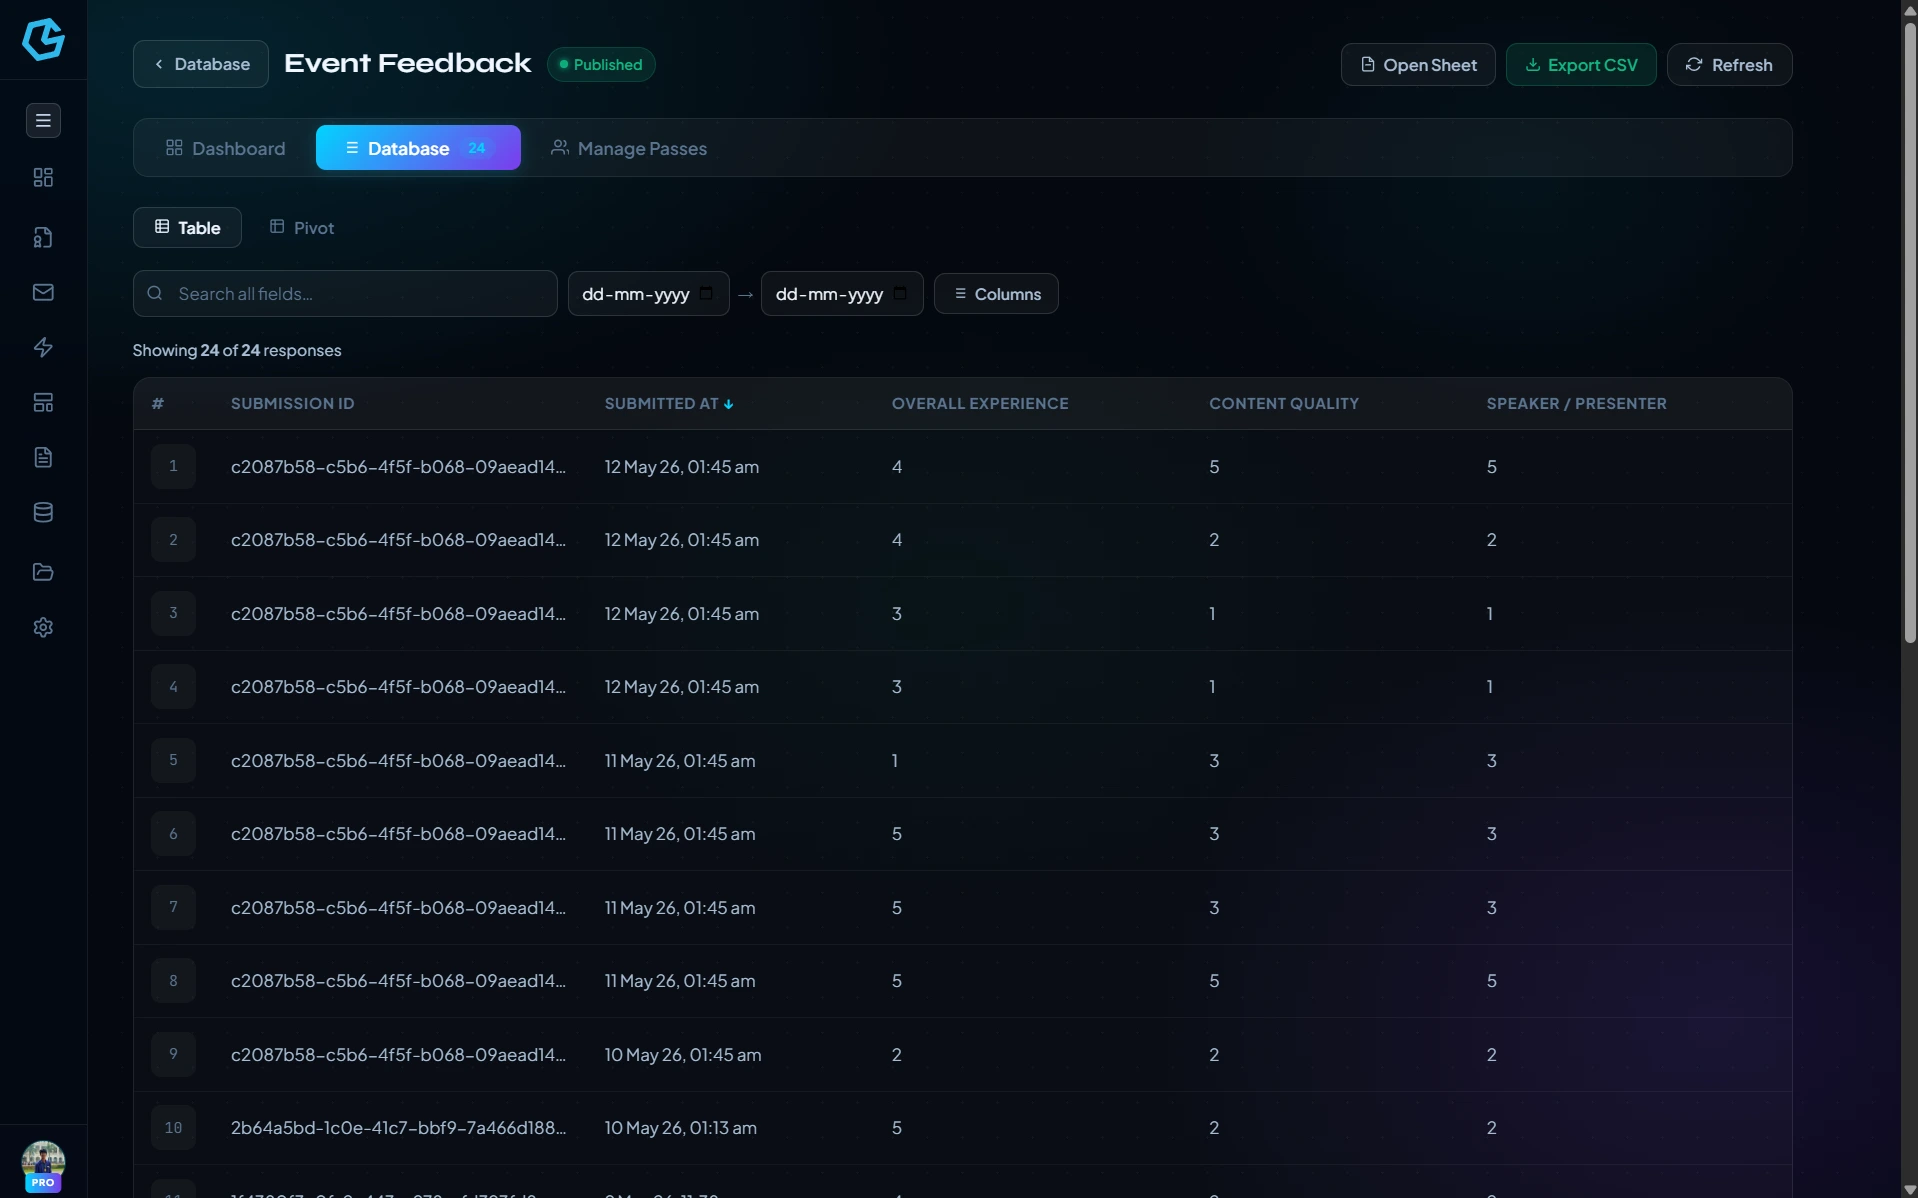
SearchFind records with relevant names, emails, tokens and other values.
FiltersFilter source, ownership and record state to narrow the working set.
SortingReorder tabular data when chronology or ranking matters.
PaginationWork through large datasets without presenting everything at once.
Quick accessKeep recently opened data sources available for faster return visits.
GalSol — Data TableFilter: Published
GalSol — Data Table
GalSol Analytics data table view with search, filters and pagination
Data view — search, filters, table, paginationSECONDARY
03 · GS Forms connection

From response to insight without moving the data.

GS Forms is one of the most important sources inside Analytics. Published registration forms can surface response counts and detailed records, and those same records can become the base for charts and dashboard widgets.
Read submission counts and response totals for forms in the workspace.
Filter forms by published, closed and data-bearing states.
Open form-level analytics directly from the Analytics workspace.
Use form fields as the underlying data for charts, tables and summaries.
Track response changes over time with live refresh support.
Explore GS Forms ↗
Analytics — GS Forms overview
GalSol Analytics GS Forms source and response analytics
Form source — response analyticsPRIMARY
04 · Pass analytics

Know the state of every pass.

Analytics connects to the pass ecosystem so organisers can review pass activity alongside response data, rather than treating entry credentials as a separate system.

Show pass status summaries at a glance.
Review pending, admitted and blocked totals.
Open individual pass records for deeper inspection.
Manage pass access and relevant bulk pass actions.
05 · Attendance

Connect scanner activity to the event picture.

Attendance data created by the GS Scanner and pass system can be read alongside pass records, allowing organisers to compare issued credentials with actual admission activity.
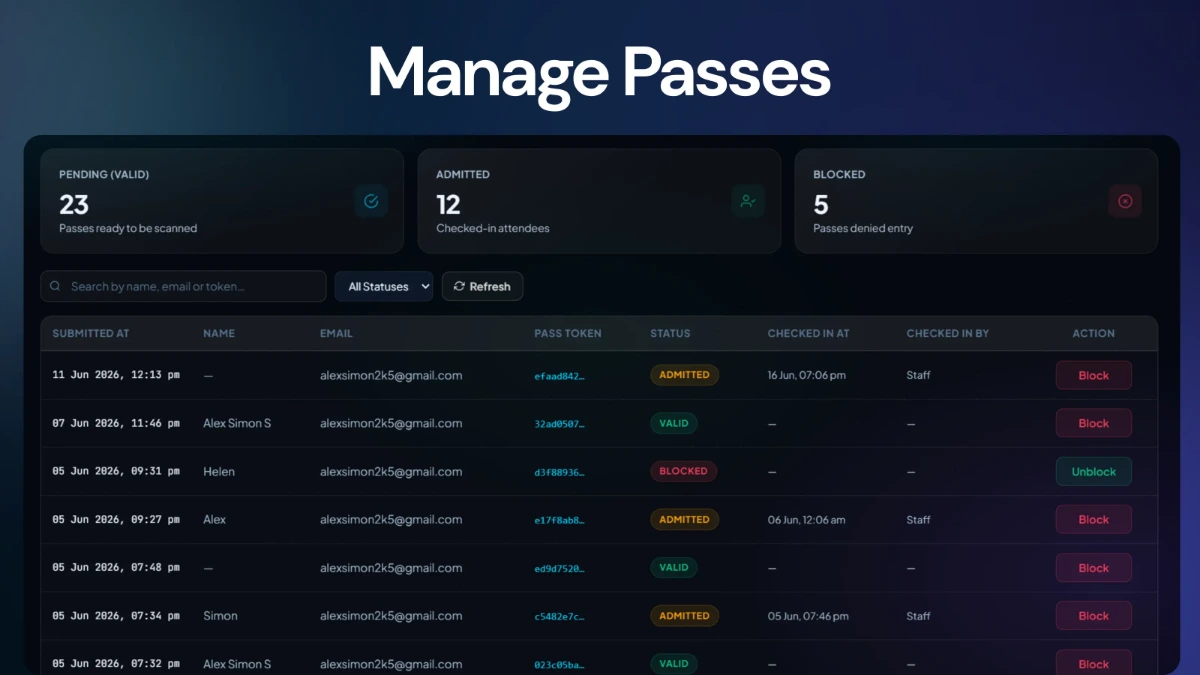
Track admitted activity.
Review current status alongside the underlying pass record.
Tie scanner activity back to the event and attendee context.
Use attendance signals as part of the wider dashboard story.
Analytics — Passes & Attendance
GalSol Analytics passes and attendance view
Pass status — attendance activitySECONDARY
06 · External data

Your useful data doesn't have to start in GalSol.

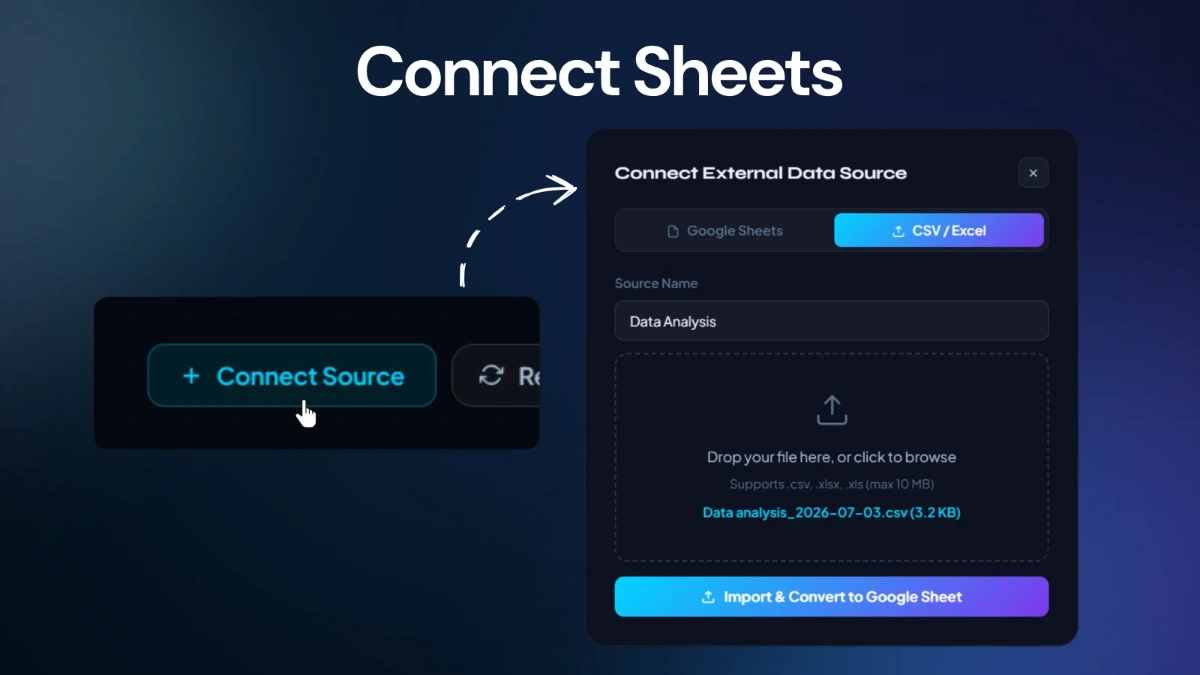
Analytics can also work with data that already exists elsewhere, so teams can bring operational spreadsheets and uploaded tabular files into the same analytical environment.

Connected sources

Bring existing data into the same view.

Connect the source that already contains the information you need, then use Analytics to inspect, filter and visualise it.
GS
Google SheetsConnect a Google Sheet as an external data source and use its rows as analytical data.
CSV
CSV filesImport CSV data as tabular source material for analysis.
XLS
Excel filesBring existing workbook data into the Analytics environment.
SYNC
External syncKeep connected source data available in the same analytics interface.
Analytics can filter between GS Forms and external sources so the workspace remains unified without pretending every source is the same kind of data.
Analytics — Data Sources
GalSol Analytics external data source connection
Source connection — recent sourcesPRIMARY
07 · Collaboration

Share the right slice of the workspace with the right people.

Analytics supports shared access without forcing every collaborator into the same permission level. Dashboard, responses and passes can be governed independently.

Separate access for dashboard, responses and passes.
Share analytics access with team members by role.
Keep access scoped to the part of the data workspace a person needs.
Support mixed view-only and editor access across sections.
Permission model

Dashboard access does not have to mean everything.

A collaborator can be allowed to view a dashboard while another role may work with response data or pass operations. Analytics keeps these grants conceptually separate so the workspace remains controlled.

DashboardVIEW / EDIT
ResponsesVIEW / EDIT
PassesVIEW / EDIT
08 · AI analytics

Go from a plain dataset to a useful dashboard faster.

The Analytics AI layer helps translate data into visual structure. It can suggest appropriate chart types, build a complete dashboard layout, and help rearrange an existing dashboard without requiring manual setup for every widget.

01
Understand the dataWork from the source fields and current dashboard context.
02
Suggest chartsRecommend visualisations that suit the data instead of choosing randomly.
03
Build the layoutCreate a complete widget arrangement from the dataset.
04
Refine existing viewsRearrange widgets or improve an existing analytical layout with guidance.
Example interaction
Build a dashboard that shows registrations by month, department mix, pass status and attendance.
I'll use the date, department, pass-status and attendance fields to create a compact event overview with trend, category and status widgets.
Suggested layout
01 · Response trend
02 · Department distribution
03 · Pass-status summary
04 · Attendance comparison
05 · Recent records table
09 · More inside Analytics

A few more capabilities that make the workspace practical.

The value is not only in the big dashboard. These smaller controls make repeated analysis faster.

A01

Recently opened sources

Return quickly to data sources you have already been working with.

A02

Source filters

Switch the workspace between GS Forms and external sources.

A03

Ownership filters

Separate your own data sources from shared sources when the workspace contains both.

A04

Status filters

Focus on published, closed or data-bearing form sources.

A05

Pass management

Review pass records and perform supported bulk pass operations.

A06

Form-level access

Open analytics for a specific form while retaining the broader workspace.

A07

Dashboard persistence

Save custom widget layouts and return to the same analytical arrangement.

A08

Manual layout building

Build a dashboard yourself when you want exact control instead of using generated suggestions.

A09

Generated suggestions

Start from an automatically suggested analytical structure based on the current data.

A10

Mixed source workspace

Keep different source types discoverable from one Analytics home.

A11

Live data orientation

Designed for event data that changes as registrations and attendance happen.

A12

Team-friendly permissions

Keep sensitive response and pass access aligned to each collaborator's role.

The final layer

GS Forms collects it. Passes and attendance add context. Analytics makes it readable.

Use one connected workspace to inspect responses, compare source data, understand pass and attendance activity, and turn live event data into dashboards that help your team decide what to do next.